How We Priced Our Book With An Experiment
Summary: We conducted a large experiment to test pricing strategies for our book and came to some very surprising findings about allowing customers to pay what they wanted.
Specifically, we found strong evidence that we should let customers pay what they want, which would help us earn more money and more readers when compared with traditional pricing models. We hope our findings can inspire other authors, musicians and creators to look into pay-what-you-want pricing and run experiments of their own.
To get automatically notified about new posts, you can subscribe by clicking here. You can also subscribe via RSS to this blog to get updates.
Introduction: Pay What You Want?
My co-authors (Henry Wang, William Chen, Max Song) and I have been working on our book, The Data Science Handbook, for over a year now. Shortly before launch, we asked ourselves an important question that many authors face: how much should we charge for our book?
We had heard of Pay-What-You-Want (PWYW) models, where readers can purchase the book for any amount they want (or at least above a threshold you set). However, many authors and creators worry that only a small percentage of people will contribute in a PWYW pricing model, and that these contributors will opt for meager amounts in the $1-$5 range.
On the other hand, we also felt that PWYW was an exciting model to try. A PWYW model would allow us to get the book out to as many people as possible without putting the book behind a paywall. We also had an inkling that this experimental pricing model would increase exposure for our book.
So we set out to answer this simple question: how should we price our book?
As practicing statisticians and data scientists, we thought of no better way to decide this than to run a large-scale experiment. The following section details exactly what we tested and discovered.
TL;DR - Letting Customers Pay What They Want Wins the Day
We experimented with 7 different pricing models pre-launch, with our subscriber base of 5,700 people. In these 7 different models, we compared different pricing schemes, including fixed prices at $19 and $29, along with several Pay What You Want (PWYW) models with varying minimum amounts and suggested price points.
Before the experiment began, we had agreed to choose whichever variant maximized the two things we cared about: the total number of readers and net revenue (later on, we’ll explain how we prioritized the two).
Before conducting the experiment, we thought that setting a fixed price at $29, like a traditional book, would lead to the maximum revenue.
After we analyzed our results, to our surprise, we discovered strong statistical evidence that with a PWYW model for our book, we could significantly expand our readership (by 4x!) while earning at least as much revenue (and potentially even more) as either of the fixed-priced variants.
The Prices We Tested: Setting Up Our Experiment
On notation: throughout this post, PWYW models will be described as (Minimum Price/Suggested Price). Example. ($0/$19) means ($0 Minimum Price, $19 Suggested Price).
Through a sign-up page on our website, we’ve been continuously gathering email addresses of individuals interested in our book throughout the process of promoting the Data Science Handbook.
We conducted this pricing experiment before the official launch of the book by letting our 5,700 subscribers pre-order a special early release of the book. The following diagram shows our experimental setup:
->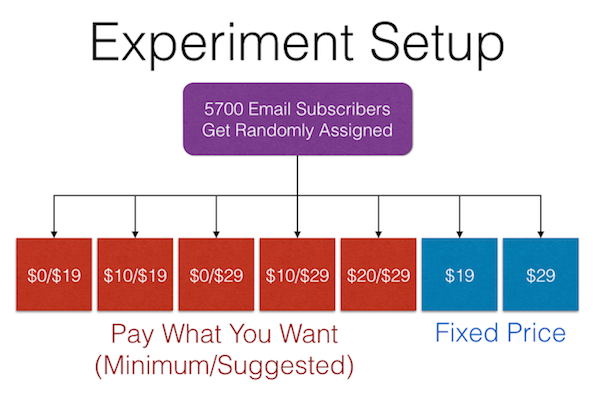 <-
<-
We started the early release pre-order process on Monday, April 20th. We stopped the pre-orders one week later, so that we could analyze our results.
Through Gumroad, we tracked data on the number of people who landed on each link, whether they purchased, and how much they chose to pay.
Note: To guard against people buying the book who were not originally assigned to that bucket (for example, those who inadvertently stumbled across our links online), we filtered out all email addresses that purchased a book through a variant that they were not explicitly assigned to. This gave us more confidence in the rigor of our statistical analyses.
What We Found: Experiment Results
The roughly 800 users in each of our experimental buckets went through a funnel, where they clicked through the email to visit the purchase page, and then decided whether or not to purchase. We collected data on user behavior in this funnel, as well as the price they paid.
->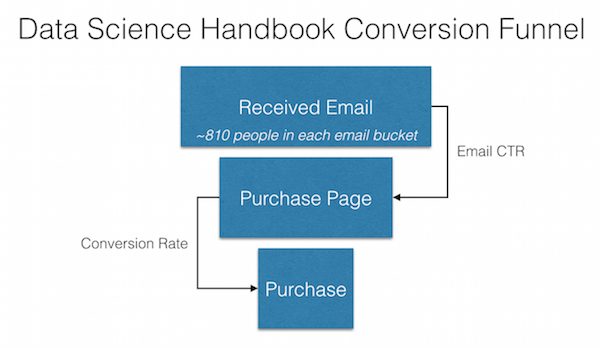 <-
<-
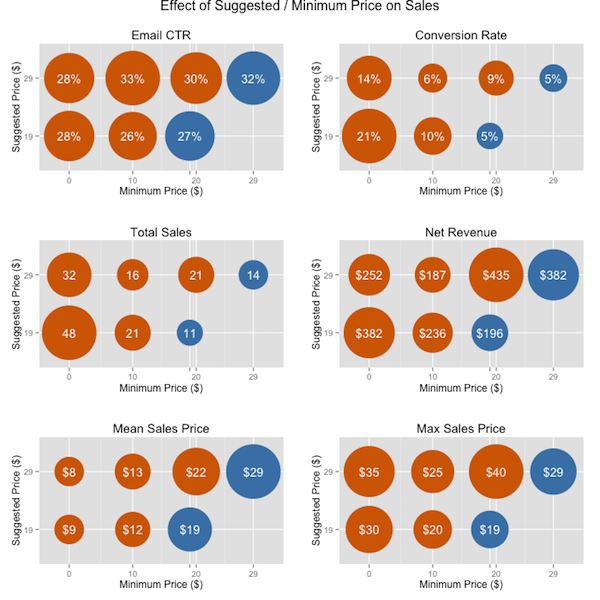
For each of the experimental variants, we collected data on 6 key metrics:
- Email CTR - # of people who clicked through to the purchase page / # of people who received the email. The emails were identical, minus the link and a short section about the price.
- Conversion Rate - # of purchases / # of people who clicked through to the purchase page
- Total Sales - # of sales, regardless of whether a reader paid $0 or $100
- Net Revenue - Total revenue generated, minus fees from Gumroad
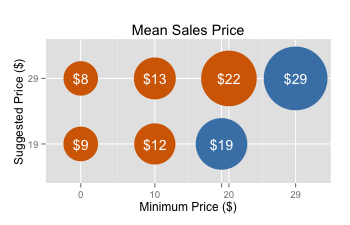
- Mean Sales Price - Average sales price that people paid
- Max Sales Price - Largest sales price paid in that bucket
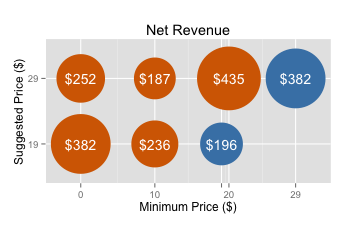
Below, you’ll see some plots on how each pricing variant performed on each metric. Each of the seven circles represents a different pricing variant, with the area of the circle being proportional to the magnitude it represents. The larger the circle, the “better” that pricing variant did in terms of our metrics.
The blue circles are the variants that were fixed at $19 and $29. The orange circles are the PWYW variants.
The X-axis of the following plots describes the minimum prices we offered: free, $10, $19 (this was a fixed price), $20 and $29 (also fixed). The Y-axes are the prices we suggested when we were using a PWYW variant: $19 and $29.
-> <-
<-
-> <-
<-
Looking above, it’s no surprise at a PWYW model of ($0/$19) had the highest conversion rate (upper right plot), and as a result the greatest number of people who downloaded the book . After all, you can get it for free!
Much to our surprise, many of our readers who got this variant paid much more than $0. In fact, as you can see above in the “Mean Sales Price” plot in the bottom left corner, our average purchase price was about $9. Some readers even paid $30.
To examine the distribution of payments we received for each variant, we also examined the histogram of payments for each of the 5 PWYW variants:
->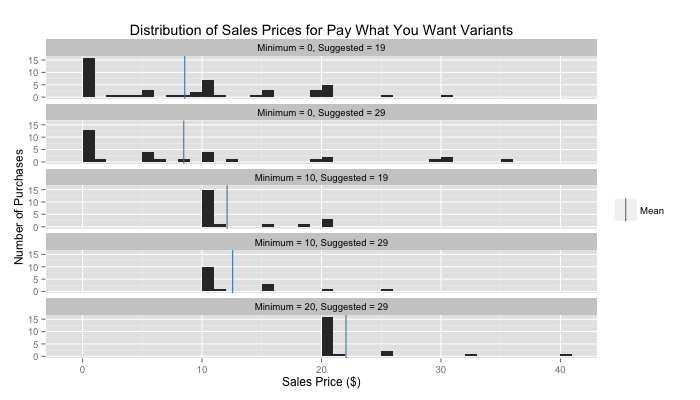 <-
<-
It’s again no surprise to see a large chunk of purchases at the minimum. However, you can also see fairly sizable clumps of readers who pay amounts around $5, $10, $15 and $20 (and even some who paid in the $30-$50 range).
In fact, readers seemed to like paying amounts that were multiples of $5, perhaps because it represented a nice round number.
Surprising Insights on Pay What You Want
You Can Earn As Much from a PWYW model (and possibly more) as from a Fixed Price model
Traditional advice told us that we should price our book at a high, fixed price point, since people interested in advancing their careers will typically pay a premium for a book that helps them do exactly that.
However, our ($0/$19) variant was ranked second in total revenue generated (tying with a fixed price of $29).
-> <-
<-
In fact, if anything, the data lends credence to the belief that you can earn even more from PWYW than from setting a fixed price.
What do we mean by that?
Well, our ($0/$19) variant actually made nearly twice as much money as fixing the price at $19. The difference in earnings was large, and is strong statistical evidence that our book would make more money if we made it free, and simply had a suggested price of $19, than if we had fixed the price at $19.[1]
This was an incredible result, since it suggested that with a PWYW model, we could generate the same amount of revenue as a fixed price model, while attracting 3-4x more readership!
Higher Suggested Price Didn’t Translate to Higher Average Payments. But…
The “suggested” price didn’t seem to have seem to have a large impact on the price people paid. Compare the mean purchase prices between $19 suggested and $29 suggested in both the $0 minimum variants and the $10 minimum variants.
-> <-
<-
As you can see, moving the suggested price from $19 to $29 in both cases increased average purchase price by only $1.
However, we don’t mean to imply the suggested price had zero effect. In fact, the data lends support to actually having a lower suggested price.
You can look to see what happened to conversion rates when we changed the suggested price from $19 to $29. In both cases we tested ($0 minimum and $10 minimum), a lower suggested price had a higher conversion rate, and drove ultimately more revenue.[2]
Therefore, it seems that even if the average sale is the same despite different suggested price, total sales increased when you have a lower suggested price. This is perhaps due to certain readers being turned off by a higher suggested price, even if they could get it for $0.
Just imagine seeing a piece of chocolate being offered for free, but having a suggested price of $100. You might scoff at the absurdly high suggested price and refuse the candy, despite being able to take it for nothing.
On the other hand, if you were offered the same scenario, but this time the free candy had a suggested price of just $0.25, you may see this as fair and be much more inclined to part with your quarter.
Try It Out For Yourself
We think that all of these findings should spur authors and creators to conduct testing on their own product pricing. Gumroad, our sales platform, makes it remarkably easy to create product variants, which you can email out to randomized batches of your followers. Or, you can use the suite of A/B testing tools to ensure that different visitors to your website receive different product links.
By doing so, you may discover that you could reach a larger audience, while also earning higher revenue.
[1] This result just missed the cutoff for statistical significance. The actual p-value comparing $0/$19 with a fixed $19 was 0.057, missing our threshold of 0.05 necessary to qualify as statistically significant. Nevertheless, the very low p-value is a strongly suggestive result in favor of a PWYW model.
[2] Beyond being practically significant, this was also statistically significant with a p-value close to 0.
If you want to be notified when my next article is published, subscribe by clicking here.
